Overview
Earth Sciences as a discipline in the US has a well documented lack of racial diversity, with little progress made as a discipline over the past 40 years (Bernard and Cooperdock, Nature Geoscience, 11, 292, 2018). Demographic data is important as a way of assessing progress towards our goals of diversity and inclusivity. The data can help to identify where progress is most needed, and can help to identify how best to allocate resources. Some demographic data are protected by privacy considerations, particularly for relatively small segments of the university such as our department. We therefore draw on demographic data from wider cross sections of the university as well.
Proposals for change
- Collect additional anonymized demographic data from the department including:
- Students entering and leaving (in addition to entering) and in what capacity did they leave (graduate with masters/PhD? what did they come in as?)
- Postdoctoral students
- Invited speakers (could be an optional survey before coming)
- International students (graduate and undergraduate)
- Sexual orientation data from faculty/staff
- Report additional anonymized demographic data from the department to the extent permitted by privacy concerns including
- Undergraduate student demographic data on the UCLA DEI website
- Separate the reporting of international student data by demographic
- DEI coordinator could put together a survey to collect data not only on demographics but also on how members of the department perceive climate, the extent to which they feel they have been supported and made to feel part of the department, etc.
- Demographic information could be used by the DEI committee to help evaluate the effectiveness of past initiatives and to identify areas that particularly need attention or additional resources.
General Demographic Data:
Faculty Demographic data is presented by the Office of Diversity, Equity, and Inclusion (https://equity.ucla.edu/data-hub/senate-faculty-diversity/, Figure 1). As of Spring 2021, the total number of current, more than 50% time faculty is 27 with 70% male and 30% female. Twenty faculty are considered full professors, 85% of which are male. Only 5 faculty members are non-white (4 – Asian, 1 – Hispanic).
Graduate Student Demographics are provided by the Graduate Admissions department (Figure 2). The admissions process seems to favor Domestic Non-Underrepresented Minorities increasing their percentage in Admissions from Applications by over 10% for Fall of 2020 (averaged over the past 12 years by over 20%). International students are seemingly disadvantaged in the admissions process with over 10% less admits than there were applicants (if averaged over the past 12 years by over 20%).
It should be noted that international students are not separated by US minority status.
Undergraduate Student Demographic data for the department is currently unavailable. However, we do have campus-wide student demographics (https://www.universityofcalifornia.edu/about-us/information-center/admissions-residency-and-ethnicity). The proportion of White students admitted in the past five years hovers around 21.1%. In comparison, the proportion of African American students admitted hovers around 4.4%. The remaining ethnicities, in order of decreasing average proportion, are Asian (~30%), Chicano/Latino (~24.6%), International (~16.6%), Unknown (~2.8%), and Native American (~0.5%).
Postdoctoral Student Demographic data are provided by the Graduate Admissions department (https://grad.ucla.edu/graduate-program-statistics/postdocs/?t=AnnualSnapshot). From this resource, we found out that for the 2020-2021 academic year, 65% of postdocs in the physical sciences identify as Male, with only 25% identifying as female (rest chose not to answer). For comparison, the university as a whole has 52% male-identifiying postdocs and 39% female-identifying postdocs. Examining historical trends, we can see that the proportion of male-identifying students has decreased recently but the proportion of female-identifying students has not changed significantly. Moreover, among domestic postdoc students in the university as a whole, 19% are underrepresented minorities compared to 11% in the physical sciences.
Non-academic Staff Demographics are presented by the Office of Diversity, Equity, and Inclusion (link to non-academic staff data). The latest data (November 2019) show that 48.9% of non-academic staff in the Earth Planetary and Space Sciences department are White, down from 62.2% in 2017. In the 2009-2019 period, the proportion of African-American members of staff has decreased from 11.5% to 0%.The proportion of staff members whose race/ethnicities are unknown or are two or more races has increased from 7.7% to 24.5% over the same period. In stark contrast, in the university as a whole, the proportion of non-academic staff who are White as of November 2019 is 28.4% and the proportion who are African-American is 10.7%.
Lists of past invited speakers are located here. However, no demographics data was collected on the invited speakers.

Figure 1: Demographics Data for Earth, Planetary, and Space Sciences separated by race and gender.
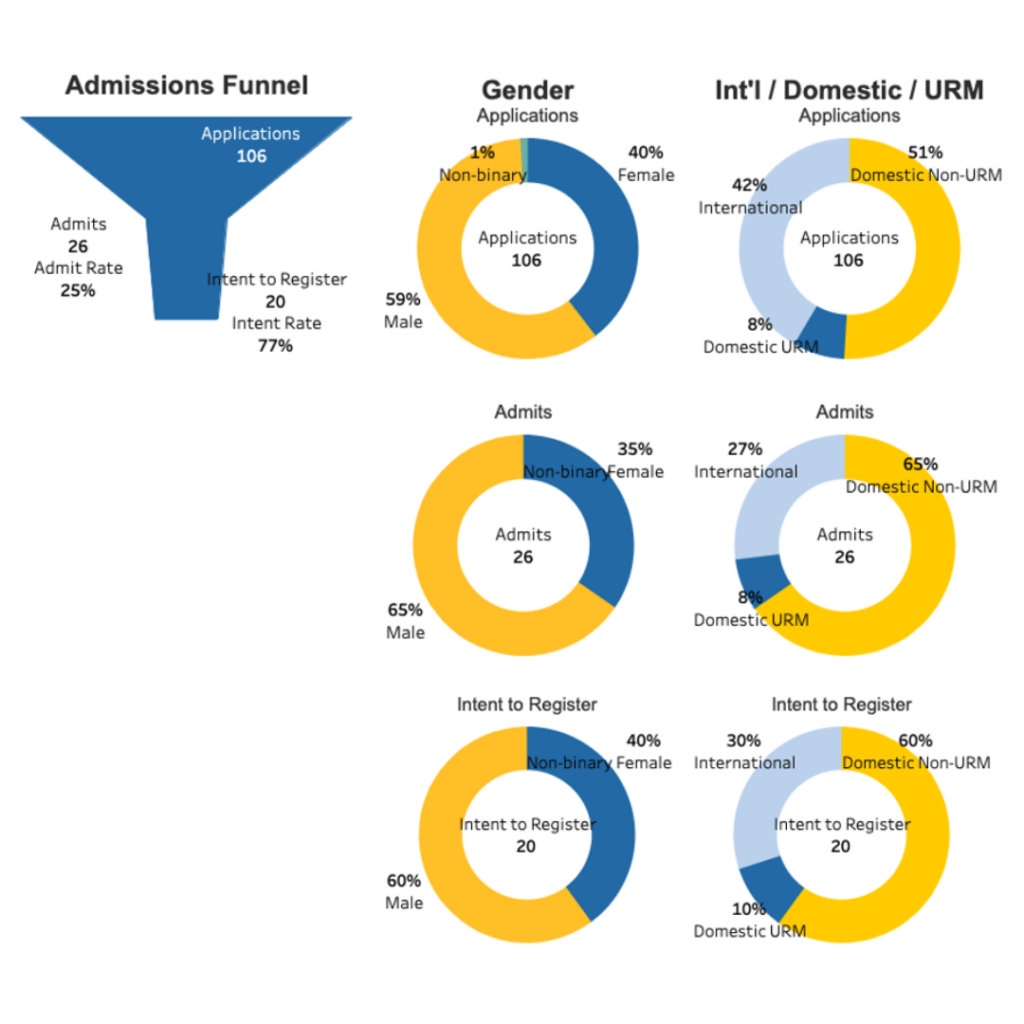
Figure 2: Admissions Demographics for EPSS Graduate Students for applicants, admits and intent to register Fall 2020.
Comparing UCLA geosciences to others and the field as a whole:
Faculty: Information on the faculty level was found from the UCLA Office of Equity, Diversity, and Inclusion (EDI) datahub. Overall, we have found that overall, 65% of faculty at UCLA are male. In the physical sciences and EPSS, 83% and 73% of faculty are male, respectively. In EPSS, 87% of full professors are male. From 2009-2014, the department had no female full professors. Currently 4 out of 8 female faculty are full professors, and 17 out of 18 male professors are full professors (>0 % FTE).
As of 2019, 63.5% of faculty at UCLA are White, 20.0% are Asian/Asian American or Pacific Islander, 6.7% are Chicana(o)/Latina(o)/Hispanic, 4.6% are Black or African American, 0.7% are American Indian or Alaskan Native, 1.6% are Two or More Races, and 2.9% are unknown. Comparatively, 75.6% of faculty in UCLA EPSS are white, 13.1% are Asian/Asian American or Pacific Islander, 3.7% are Chicana(o)/Latina(o)/Hispanic, and 7.5% are unknown.
Students: On the student level, we have found that it is difficult to compare undergraduate and graduate statistics because the DEI and admissions department has not yet published demographic data based on race. It is also difficult to receive the data on a departmental level because of confidentiality issues stemming from the department having a small population of students. Additionally, we find that there is no departmental data for first generation students despite the fact that 8% of geoscience students are first generation. No information on postdoctoral students was found.
Degrees awarded: Data on degrees awarded can be found in this link with information on both UCLA and all UC schools dating back to 1999. The link included is interactive and allows the user to select data based on degree level, UC institution, race/ethnicity, gender, academic year, and term. Overall, more women were awarded bachelor’s degrees on both a UC wide and UCLA level. However, more men were awarded masters and doctoral degrees for both a UC wide and UCLA level.
Geosciences field: According to a study by Kermen et al. (2021), membership data collected by the American Association of Petroleum Geologists (AAPG), American Geophysical Union (AGU), and the Geological Society of America (GSA) show continued evidence of gender inequity in professional geological sciences, particularly in the AAGP. They find that women membership for the AAPG hovered between 19-21% since 2014, around 30% for AGU membership, and about 33% for GSA membership. Data from the National Science Foundation (NSF) and American Geosciences Institute (AGI) indicate that the percentage of women with geosciences degrees decreased from 17% to 11% between the years 2010 and 2017.
Public goals on demographics or increasing representation:
We found that our chancellor has a general statement on diversity, including why it should be an integral value of the University’s aspirations. Here is a sample quote from the statement:
“The University of California renews its commitment to the full realization of its historic promise to recognize and nurture merit, talent, and achievement by supporting diversity and equal opportunity in its education, services, and administration, as well as research and creative activity.”
Furthermore, the College of Physical Sciences has a statement in support of diversity as well as a concrete strategic plan on how they plan to increase representation. An example of this is by requiring staff to conduct implicit bias training before they begin working for the University.
EPSS DEI goals are published on the website of the departmental DEI committee (https://ccle.ucla.edu/course/view/epss-diversity). An example of this would be requiring implicit bias training for staff specifically for fieldwork trips. Other suggestions include making the graduate admissions decision-making process more transparent to all students who apply to the department. Moreover, we encourage incentivizing both students and faculty to engage in outreach programs relating to science communication and community college recruitment. This can be achieved through any of the following:
- Having a minimum number of outreach hours that each graduate student/faculty member must attain throughout their academic year
- Advertising outreach programs on orientation days to new admits
- Rewarding impressive amounts of outreach for both students and faculty with monetary gifts from the department
Policy or proposed policy for collecting demographic data at UCLA:
Currently demographics data is collected for faculty and staff data from UCPath and the (former) UCLA Personnel Payroll System (PPS). Demographics data for students is collected (upon entering and exiting?) . It is reported on the UCLA Diversity, Equity and Inclusion website, as well as by the Graduate Admissions department.
What did you learn about other organizations (or in general) while investigating demographic data?
https://diversity.ldeo.columbia.edu/seminardiversity – Increase diversity in seminars
https://www.nature.com/articles/d41586-019-03784-x – No all-male panels
https://www.nature.com/articles/d41586-020-01294-9 – Are women publishing less during the pandemic?